


BlueTherm Pro app for iPhone and iPad
Developer: Electronic Temperature Instruments Ltd
First release : 24 Mar 2015
App size: 0 Bytes
**MONITOR AND RECORD MULTIPLE TEMPERATURES AT ONCE AS PART OF YOUR INDUSTRIAL, SCIENTIFIC, OR FOOD SERVICE PROCESS**
BlueTherm Pro from Electronic Temperature Instruments Ltd is designed to allow Apple Devices to be used in conjunction with the BlueTherm Duo, as an easy-to-use 2-channel thermocouple thermometer. Create and save custom process profiles, monitor temperature readings with customizable recording update rates, graph results and email data to your inbox to store electronically.
FEATURES
Create and Save custom process “profiles”
Name your probes
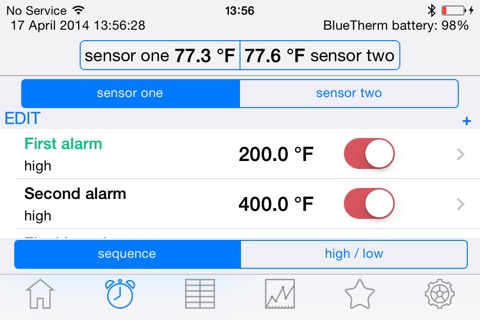
Build alarms sequences for each probe
Customize temperature recording intervals
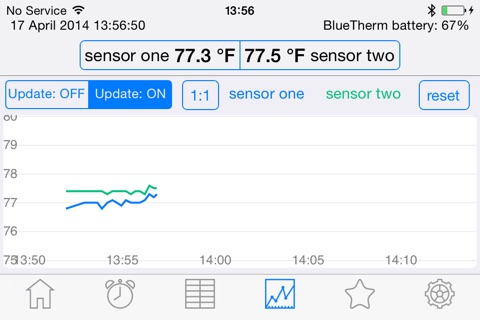
Record temperature data in a graph
Email temperature data to store electronically
Add notes to document changes in the process
Edit alarms quickly from Home tab
Continuous Min/Max temperature display
HOW TO GET STARTED
Download the BlueTherm Pro App
Enable bluetooth and sync your BlueTherm using the serial number on the back
Enter the PIN 1234 to complete sync
BlueTherm Pro will automatically start monitoring and recording with default settings when connected
Change your display update rate, recording interval, min/max settings, and switch between C/F in the “Settings” tab
Change or add high/low and sequence alarms in the “Alarm” tab
Change sensor names in the “Home” tab
Save Profile by going to the “Profiles” tab and select “Save current settings”. Saved Profiles can be accessed later to update all setting with one button.
HOW TO VIEW READINGS
Temperature readings can be viewed under the “Table” or “Graph” tabs. These will update with the recording intervals set earlier. Sequence alarms will be displayed on the graph with a pin.
HOW TO VIEW SAVED READINGS
Previously recorded data can be accessed by going to the “Table” tab and selecting “Saved Data.” Select the data session you’d like to review. You can switch between reviewing the table or graph by selecting the “Table/Graph” button to the right of “Email Data.”
HOW TO EMAIL RESULTS
The prompt to email recorded data is found under the “Table” tab. Select the “Email Data” button and saved data sessions will be listed. Select which session you would like to email, and enter your recipients email address. A CSV file will be created and automatically sent.